Demand Generation Manager Interview Scorecard
 ZYTHR Resources •
September 11, 2025
ZYTHR Resources •
September 11, 2025
TL;DR
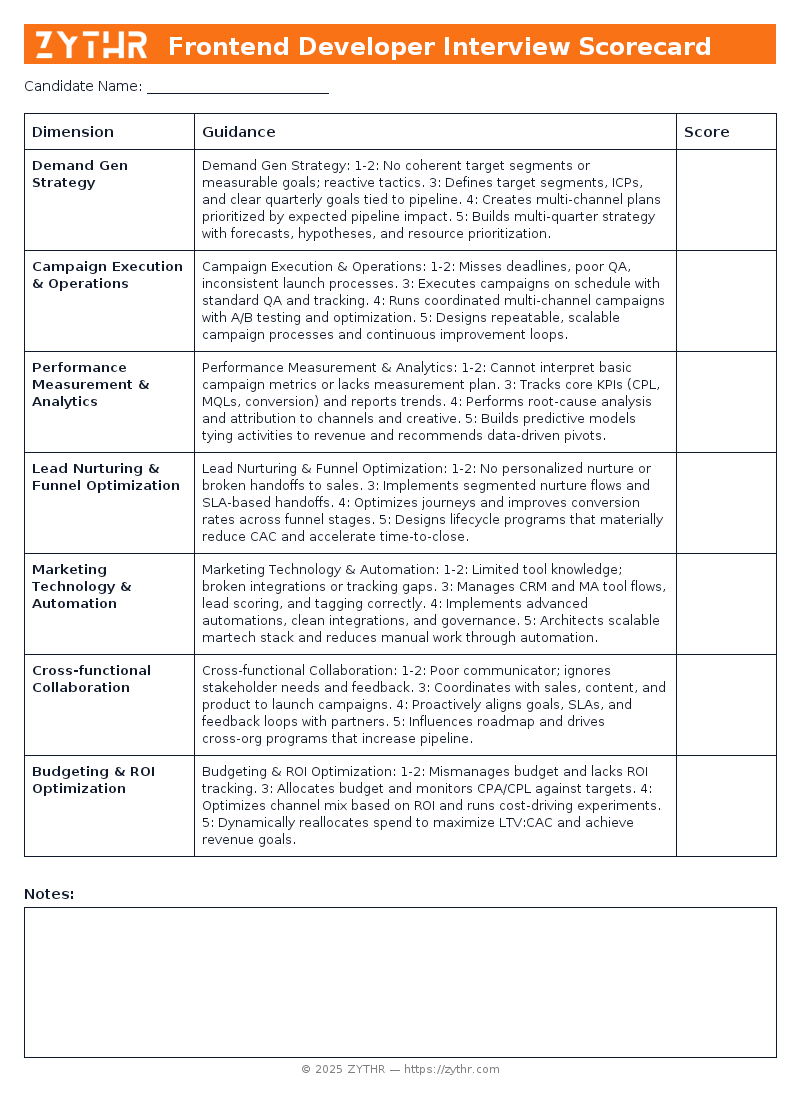
This scorecard evaluates core skills for a Demand Generation Manager, focusing on strategy, execution, analytics, martech, collaboration, and budget optimization. It helps interviewers rate candidates consistently and predict their ability to drive pipeline and revenue.
Who this scorecard is for
For hiring managers, marketing leaders, and interviewers assessing mid-to-senior Demand Generation Manager candidates. Use this to align interviewers on criteria and surface evidence of impact.
Preview the Scorecard
See what the Demand Generation Manager Interview Scorecard looks like before you download it.
How to use and calibrate
- Pick the level (Junior, Mid, Senior, or Staff) and adjust anchor examples accordingly.
- Use the quick checklist during the call; fill the rubric within 30 minutes after.
- Or use ZYTHR to transcribe the interview and automatically fill in the scorecard live.
- Run monthly calibration with sample candidate answers to align expectations.
- Average across interviewers; avoid single-signal decisions.
Detailed rubric with anchor behaviors
Demand Gen Strategy
- 1–2: No coherent target segments or measurable goals; reactive tactics.
- 3: Defines target segments, ICPs, and clear quarterly goals tied to pipeline.
- 4: Creates multi-channel plans prioritized by expected pipeline impact.
- 5: Builds multi-quarter strategy with forecasts, hypotheses, and resource prioritization.
Campaign Execution & Operations
- 1–2: Misses deadlines, poor QA, inconsistent launch processes.
- 3: Executes campaigns on schedule with standard QA and tracking.
- 4: Runs coordinated multi-channel campaigns with A/B testing and optimization.
- 5: Designs repeatable, scalable campaign processes and continuous improvement loops.
Performance Measurement & Analytics
- 1–2: Cannot interpret basic campaign metrics or lacks measurement plan.
- 3: Tracks core KPIs (CPL, MQLs, conversion) and reports trends.
- 4: Performs root-cause analysis and attribution to channels and creative.
- 5: Builds predictive models tying activities to revenue and recommends data-driven pivots.
Lead Nurturing & Funnel Optimization
- 1–2: No personalized nurture or broken handoffs to sales.
- 3: Implements segmented nurture flows and SLA-based handoffs.
- 4: Optimizes journeys and improves conversion rates across funnel stages.
- 5: Designs lifecycle programs that materially reduce CAC and accelerate time-to-close.
Marketing Technology & Automation
- 1–2: Limited tool knowledge; broken integrations or tracking gaps.
- 3: Manages CRM and MA tool flows, lead scoring, and tagging correctly.
- 4: Implements advanced automations, clean integrations, and governance.
- 5: Architects scalable martech stack and reduces manual work through automation.
Cross-functional Collaboration
- 1–2: Poor communicator; ignores stakeholder needs and feedback.
- 3: Coordinates with sales, content, and product to launch campaigns.
- 4: Proactively aligns goals, SLAs, and feedback loops with partners.
- 5: Influences roadmap and drives cross-org programs that increase pipeline.
Budgeting & ROI Optimization
- 1–2: Mismanages budget and lacks ROI tracking.
- 3: Allocates budget and monitors CPA/CPL against targets.
- 4: Optimizes channel mix based on ROI and runs cost-driving experiments.
- 5: Dynamically reallocates spend to maximize LTV:CAC and achieve revenue goals.
Scoring and weighting
Default weights (adjust per role):
| Dimension | Weight |
|---|---|
| Demand Gen Strategy | 18% |
| Campaign Execution & Operations | 17% |
| Performance Measurement & Analytics | 18% |
| Lead Nurturing & Funnel Optimization | 15% |
| Marketing Technology & Automation | 12% |
| Cross-functional Collaboration | 10% |
| Budgeting & ROI Optimization | 10% |
Final score = weighted average across dimensions. Require at least two “4+” signals for Senior+ roles.
Complete Examples
Demand Generation Manager Scorecard — Great Candidate
| Dimension | Notes | Score (1–5) |
|---|---|---|
| Demand Gen Strategy | Presents a multi-quarter strategy tied to pipeline forecasts and prioritization rationale. | 5 |
| Campaign Execution & Operations | Operates scalable campaigns with documented playbooks and improved conversion rates. | 5 |
| Performance Measurement & Analytics | Demonstrates predictive analysis linking campaigns to revenue outcomes. | 5 |
| Lead Nurturing & Funnel Optimization | Shows experiments that increased MQL->SQL conversion and shortened sales cycle. | 5 |
| Marketing Technology & Automation | Built automations that reduced manual tasks and improved data quality. | 5 |
| Cross-functional Collaboration | Led a cross-functional initiative adopted by sales and product that improved pipeline. | 5 |
| Budgeting & ROI Optimization | Reallocated spend to high-return channels and improved overall ROI. | 5 |
Demand Generation Manager Scorecard — Good Candidate
| Dimension | Notes | Score (1–5) |
|---|---|---|
| Demand Gen Strategy | Presents segment-based acquisition goals and a channel plan. | 3 |
| Campaign Execution & Operations | Delivers campaigns with correct tracking and timely launches. | 3 |
| Performance Measurement & Analytics | Regularly reports CPL, conversion, and trend analysis. | 3 |
| Lead Nurturing & Funnel Optimization | Has segmented email journeys and defined handoff criteria. | 3 |
| Marketing Technology & Automation | Maintains lead scoring and reliable CRM syncs. | 3 |
| Cross-functional Collaboration | Regularly syncs with sales and content teams to align campaigns. | 3 |
| Budgeting & ROI Optimization | Stays within budget and meets CPA targets. | 3 |
Demand Generation Manager Scorecard — No-Fit Candidate
| Dimension | Notes | Score (1–5) |
|---|---|---|
| Demand Gen Strategy | Unable to define target segments or campaign objectives. | 1 |
| Campaign Execution & Operations | Frequent failed or late campaign launches. | 1 |
| Performance Measurement & Analytics | Cannot explain campaign contribution to pipeline. | 1 |
| Lead Nurturing & Funnel Optimization | No nurture strategy or inconsistent follow-up. | 1 |
| Marketing Technology & Automation | Tracking or CRM integrations failing. | 1 |
| Cross-functional Collaboration | Ignores sales feedback and misaligned priorities. | 1 |
| Budgeting & ROI Optimization | Overspends with negative or unknown ROI. | 1 |
Recruiter FAQs about this scorecard
Q: Do scorecards actually reduce bias?
A: Yes—when you use the same questions, anchored rubrics, and require evidence-based notes.
Q: How many dimensions should we score?
A: Stick to 6–8 core dimensions. More than 10 dilutes signal.
Q: How do we calibrate interviewers?
A: Run monthly sessions with sample candidate answers and compare scores.
Q: How do we handle candidates who spike in one area but are weak elsewhere?
A: Use weighted average but define non-negotiables.
Q: How should we adapt this for Junior vs. Senior roles?
A: Keep dimensions the same but raise expectations for Senior+.
Q: Does this work for take-home or live coding?
A: Yes. Apply the same dimensions, but adjust scoring criteria for context.
Q: Where should results live?
A: Store structured scores and notes in your ATS or ZYTHR.
Q: What if interviewers disagree widely?
A: Require written evidence, reconcile in debrief, or add a follow-up interview.
Q: Can this template be reused for other roles?
A: Yes. Swap technical dimensions for role-specific ones, keep collaboration and communication.
Q: Can ZYTHR auto-populate the scorecard?
A: Yes. ZYTHR can transcribe interviews, tag signals, and live-populate the scorecard.
See Live Scorecards in Action
ZYTHR is not only a resume-screening took, it also automatically transcribes interviews and live-populates scorecards, giving your team a consistent view of every candidate in real time.